Free public course · 26/40
Chapter 26: Risk Control and Efficiency Metrics
Lesson objectives
Required artifact: risk-and-efficiency metric tree
O1 · Can decompose quality metric into the comparable branches delivery cost and adoption evidence (artifact: risk-and-efficiency metric tree)
Evidence: The risk-and-efficiency metric tree branches from quality metric to delivery cost and adoption evidence with the hierarchy labeled
O2 · Can construct a risk-and-efficiency metric tree with a baseline, trend and trade-off for every metric (artifact: risk-and-efficiency metric tree)
Evidence: Every leaf in the risk-and-efficiency metric tree records a baseline, current value, trend and data source
O3 · Can interpret quality, cost and adoption metrics through baselines, trends and trade-offs (artifact: risk-and-efficiency metric tree)
Evidence: The artifact records a baseline, trend, source and trade-off for quality, cost and adoption metrics
Before this lesson: Chapter 25: Test Grids and Anti-Regression Contracts
Novice path
Chapter transfer task: Can interpret quality, cost and adoption metrics through baselines, trends and trade-offs. Use the diagram's tree relationship to complete the first evidence item in the risk-and-efficiency metric tree, then check each owner and decision rule.
Experienced path
Apply this task to a current project before reading the explanation: Can interpret quality, cost and adoption metrics through baselines, trends and trade-offs. Submit the risk-and-efficiency metric tree, then check the relationship type, missing evidence and authority boundary.
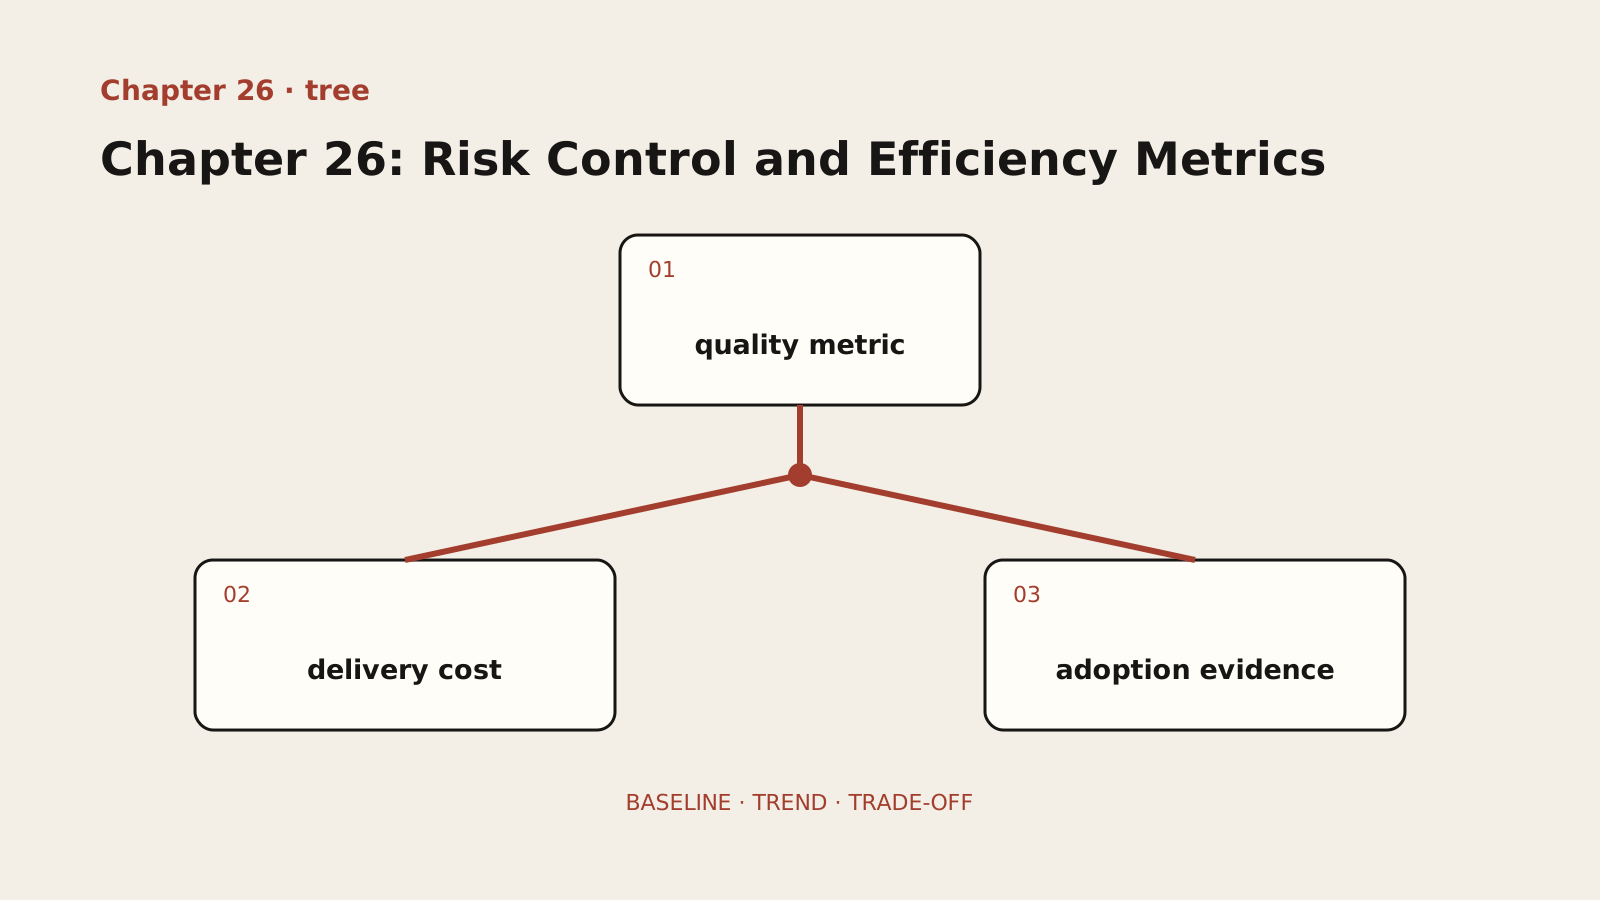
Diagram text description
The diagram places quality metric at the root and branches downward to delivery cost and adoption evidence. Branches represent a metric hierarchy and complementary views, not a sequence or release gate. Every leaf independently records its baseline, trend, source and trade-off.
Relationship semantics: A root metric branches into two complementary views whose leaves track baselines, trends and trade-offs; the branches are not stop-or-proceed gates.
Adapted public course. Concepts, procedures and examples are adapted from the internal textbook. Case sizes, timings, improvement figures and target thresholds are illustrative, not site delivery results or universal standards. Verify tools, platforms and skills in your environment. Prompts do not grant permissions and retry counts do not authorize recovery. Preserve work and verify targets, sharing and external-state effects first.
Lesson explanation
26.1 The Seven Major Risk Categories: Quality, Security, Architecture, Team, Compliance, Cost, Model Behavior
Risk is not a question of “whether it will happen,” but “when it will happen.” The key is knowing where the risks are and how to respond.
AI coding risks are not “one risk” but “a cluster of risks.” They vary in impact and probability and require differentiated treatment:
| Risk Category | Risk Description | Impact Level | Probability |
|---|---|---|---|
| Quality Risk | AI-generated code quality is uncontrollable | High | Medium |
| Security Risk | AI code introduces security vulnerabilities | High | Medium |
| Architecture Risk | Code deviates from architectural design | Medium | High |
| Team Risk | Team skills degrade or become dependent on AI | Medium | Medium |
| Compliance Risk | AI code involves copyright or compliance issues | High | Low |
| Cost Risk | API call costs exceed budget | Low | Medium |
| Model Behavior Risk | Hallucination, prompt injection, sensitive data leakage to model providers, runaway token costs | High | Medium |
Quality Risk (high impact, medium probability): AI code may be functionally correct but inconsistent in style, with inadequate error handling, performance issues, and poor maintainability. Quality risks do not erupt immediately but accumulate steadily. Prevention: establish an acceptance system, define coding standards, use automated tools. Response: assess the scope of impact —> local issues: fix and resubmit / systemic issues: roll back and rebuild —> analyze whether instructions were unclear or acceptance lacked rigor.
Security Risk (high impact, medium probability): AI code may contain security vulnerabilities. When they occur, consequences can be catastrophic (data breaches, system intrusions, compliance penalties). The probability is rated “medium” rather than “low” — the likelihood of security vulnerabilities in AI-generated code should not be underestimated (injection-class defects, outdated dependencies, and masked boundary conditions are not rare in AI code); this is precisely the rationale behind the full security review required at the deployment gate in Chapter 24. Prevention: incorporate security reviews into the acceptance process, establish secure coding standards, use security scanning tools, sensitive operations (payments, user data, authentication) must be manually reviewed. Response: fix immediately (highest priority) —> check whether other features have similar issues —> update the acceptance checklist —> for systemic security issues, suspend AI coding for that project and retrain.
Architecture Risk (medium impact, high probability): Architecture drift is “everyday” — AI produces minor architectural deviations almost every time it generates code. Individual deviations are low-impact, but cumulative drift gradually erodes the codebase structure. Moreover, it is insidious — the code runs and functions correctly, making it very difficult to detect at first glance. Prevention: include clear architectural conventions in the blueprint, verify architecture compliance during acceptance, conduct periodic architecture audits. Response: assess severity —> minor drift: record and iteratively correct / major drift (foundation tampering, volume spiral): roll back and rebuild —> update the blueprint with explicit prohibitions.
Team Risk (medium impact, medium probability): Managers overlook this most easily, because it is a “people problem” rather than a “technical problem.” Three sub-risks — skill degradation (prevention: require developers to understand AI code before acceptance, schedule regular “AI-free days”; monitoring signal: reaching for AI first on simple problems instead of thinking independently), AI dependency (prevention: “AI recommends, humans decide,” architectural decisions must be human-led; monitoring signal: AI-proposed solutions adopted without analysis), knowledge gaps (prevention: someone must understand the core code, regular code reviews, new members independently complete small features). Technical problems have clear solutions; people problems need ongoing attention and management.
Compliance Risk (high impact, low probability): AI-generated code may conflict with open-source licenses, may “recall” copyrighted code, and AI services may process sensitive data. Prevention: clarify AI tools data-handling policies, use locally deployed models or abstain from AI on sensitive projects, watch license compliance in code reviews, do not input sensitive data (passwords, keys, customer information) into AI tools.
Cost Risk (low impact, medium probability): AI tools’ API calls can incur significant costs. Costs are predictable and controllable. Control suggestions: use on demand (not every feature needs AI coding), cache results for identical or similar prompts, monitor usage, consider local deployment at scale.
Model Behavior Risk (high impact, medium probability): This is the LLM-application-specific fourth category of technical risk — runaway hallucination rates (the model confidently fabricating facts), prompt injection (malicious inputs hijacking model behavior), sensitive data leakage to model providers (customer data or keys sent into a third-party model’s training or logging pipelines), and runaway token costs (context bloat making a single call several times over budget). It differs from “cost risk” in that cost risk merely spends money, while model behavior risk directly contaminates the delivered result. Prevention: continuously monitor hallucination rates with an eval system (the evaluation-driven approach is covered in Chapter 21; the Golden Set and LLM-as-judge grading mechanisms in Chapter 22), apply injection defenses and least-privilege design to external inputs, mask sensitive data or use locally deployed models (consistent with the compliance risk handling principle), and set a token budget per call while monitoring usage. Response: for hallucination issues, roll back to the last prompt/model version that passed eval —> for suspected injection, take the affected entry points offline immediately and audit the logs —> for suspected data leakage, treat it as a security incident at the highest priority.
26.2 Risk Management Process: Identify —> Assess —> Prepare —> Execute —> Review
Example type: pseudocode. Pseudocode; it is not executable. It expresses decision order only, so implementation must supply real interfaces, authority and error handling.
Identify risks → Assess risks → Prepare contingencies → Execute them → Review and improve- Identify risks: regularly identify new risks (once per quarter);
- Assess risks: evaluate impact level and probability;
- Develop contingency plans: create preventive measures and contingency plans for high-impact risks;
- Execute plans: implement preventive measures in daily work;
- Review and improve: after a risk event, conduct a post-mortem and update the risk management plan.
Security and architecture risks deserve the most attention: security risks are far from improbable and have severe consequences; architecture risks have high probability despite moderate impact. Team risks carry far-reaching consequences. Establish a “identify-assess-prepare-execute-review” risk management process to keep risks under control rather than leaving things to luck.
26.3 Core Metrics: Efficiency, Quality, Team, and Customer-Side — Four Dimensions
Metrics are not “about showing data to your boss” but “about understanding your team’s actual situation.” Measurement serves three purposes — proving value, discovering problems, continuous improvement — the first “outward-facing,” the latter two “inward-facing.” Data uncovers process bottlenecks (e.g., a low acceptance pass rate signals instruction-quality problems) and supports continuous improvement (trend analysis shows whether the methodology is working).
More metrics are not better. For the four dimensions — efficiency, quality, team, and customer-side — 2-3 key indicators per dimension is sufficient. Too many will only leave you lost in the data.
Efficiency Metrics:
| Metric | Definition | Measurement Method |
|---|---|---|
| Delivery Cycle | Number of days from requirement confirmation to feature delivery | Record the requirement confirmation date and feature delivery date |
| Development Efficiency | Number of features completed per unit time | Features per person-day |
| AI Utilization Rate | Proportion of features built with AI coding | AI-completed features / total features |
Usage notes: delivery cycle is the most intuitive metric of AI coding effectiveness; development efficiency must be compared against historical data to avoid misleading absolute values; AI utilization rate is not “the higher, the better” — the key is using it appropriately.
Quality Metrics:
| Metric | Definition | Measurement Method |
|---|---|---|
| Defect Density | Number of defects per thousand lines of code | Defect count / lines of code x 1000 |
| Acceptance Pass Rate | Ratio of milestones passing first-time acceptance | First-pass count / total milestone count |
| Architecture Drift Rate | Proportion of features with architecture drift | Features with drift / total features |
| Test Coverage | Percentage of code covered by tests | Automated test reports |
Usage notes: defect density should be measured after project stabilization (1 month post-launch); the acceptance pass rate reflects instruction quality — a low rate signals insufficiently clear instructions; architecture drift rate is a key indicator of AI coding compliance.
Team Metrics:
| Metric | Definition | Measurement Method |
|---|---|---|
| Skill Mastery | Team’s level of proficiency with the methodology | Periodic assessment (maturity model L0—L4) |
| Standard Compliance Rate | Degree to which the team follows coding standards | Audit results |
| Team Satisfaction | Team members’ feelings about AI coding | Anonymous survey |
Usage notes: assess skill mastery quarterly; audit standard compliance monthly; conduct team satisfaction surveys during the introduction phase and after major changes.
Customer-Side Metrics:
| Metric | Definition | Measurement Method |
|---|---|---|
| Production Adoption | Actual customer adoption rate after a feature goes live | Share of target users actually using the feature within 30 days after launch |
| Customer Workflow Impact | Degree to which the feature improves the customer’s workflow time and quality | Before/after comparison of the customer workflow (time spent on the same steps, rework/error rates) |
Usage notes: the first three dimensions measure whether “the team runs fast and stays stable”; customer-side metrics answer whether “what was delivered was actually used, and the customer’s work actually got better” — they are the final judge. Persistently low production adoption means you may have delivered a feature that “passed acceptance but nobody uses”; no improvement in the before/after workflow comparison means the optimization effort went to the wrong place. For adoption and business-outcome measurement, see Sections 26.3–26.4 and the fixed-cohort weekly adoption example in Section 39.6; that weekly window differs from this section’s 30-day post-launch definition and cannot be compared directly. Part Seven evaluates model-output quality, not adoption evidence; for what each stage of a client engagement should deliver and to whom, see Part Nine (the three phases of client projects).
Here it is worth distinguishing the applicable scenarios of the two kinds of metrics: process-compliance metrics (delivery cycle, acceptance pass rate, architecture drift rate, etc.) measure whether the team’s process is healthy and are suited to internal improvement — uncovering process bottlenecks and driving continuous optimization; customer-outcome metrics (production adoption, customer workflow impact) measure the actual value the delivered result creates for the customer and are suited to scenarios where you are accountable for delivery outcomes — customer acceptance, renewal negotiations, value substantiation. Using process metrics to prove value to the customer is a common mismatch: however high the acceptance pass rate, it does not mean the customer’s workflow has genuinely improved. Look at the former in internal retrospectives, and at the latter when accounting to the customer; the two sets of metrics cannot substitute for each other.
26.4 Measurement Methods: Baseline Measurement, Trend Analysis, Comparative Analysis
Measurement is not “run the data once, look at a single number, and you are done.” Three methods help you turn data into insights:
Baseline measurement — before introducing the AI coding methodology, first measure baseline data. Without a baseline, you cannot judge whether things have “improved” or “declined.” If, after introduction, the delivery cycle is 4 days — is that good or bad? Knowing it was 5 days before tells you it improved by 20%. Baseline data examples: average delivery cycle of 5 days per feature, defect density of 15 per thousand lines, test coverage of 40%.
Trend analysis — a single data point is meaningless; only trends matter. In the first month after introduction, the delivery cycle may actually be longer than the baseline — this does not mean the methodology is ineffective; the team is in a learning phase. From the second month, as the team grows familiar with the process, metrics should gradually improve (the table below is illustrative data at demonstration magnitudes, not a measured record):
| Monthly Trend | Delivery Cycle (days) | Defect Density (per 1K lines) | Architecture Drift Rate (%) |
|---|---|---|---|
| Month 1 | 4.2 | 12 | 20 |
| Month 2 | 3.5 | 10 | 15 |
| Month 3 | 2.8 | 8 | 12 |
| Month 4 | 2.5 | 7 | 10 |
| Trend | Downward | Downward | Downward |
Comparative analysis — if conditions allow, run a comparative experiment: Group A (full methodology) vs. Group B (AI used freely, no methodology), with controlled variables (similar feature complexity, developer experience), comparing delivery cycle, defect density, and code quality. If Group A significantly outperforms Group B across multiple metrics, you have enough data to support the conclusion that “the methodology works.”
26.5 Four Measurement Traps
Trap one: focusing only on efficiency, not quality. “Our development efficiency has tripled!” — but if quality deteriorates in step, in the long run it is catastrophic. Consider a composite scenario (numbers are demonstration magnitudes): a team’s delivery cycle shrank from 5 days to 2 days after adopting AI, but post-release bug rates rose markedly — efficiency gains were offset by the cost of quality decline. The correct approach: measure both simultaneously and develop in balance.
Trap two: unfair comparisons. “After adopting AI, feature delivery went from 2 weeks to 2 days!” — but the new features may be far less complex than the old ones. A CRUD interface and a payment integration differ completely in complexity; comparing them side by side is meaningless. Correct approach: control variables and compare features within the same category.
Trap three: ignoring learning costs. “In the first week after adoption, efficiency actually dropped!” — this is normal. The team needs to learn new tools, new processes, and new habits. The learning curve means short-term efficiency dips while long-term efficiency rises. Correct approach: measure on a monthly basis, focus on trends rather than absolute values.
Trap four: metrics-driven behavior. “We require a 95% acceptance pass rate!” — the team then lowers acceptance standards to hit the target: previously, “passage required checks across three dimensions — function, architecture, and security”; now, “passing the functional check counts as passing.” Metrics look better; quality has declined. Correct approach: evaluate with multiple indicators holistically, avoid single-metric drives; also watch for signals that “metrics are being gamed.”
[Template] Team AI Coding Monthly Report
Example type: reference. Reference fragment; it is not guaranteed to run alone. Adapt it to the lesson context, project versions and real interfaces, then validate with observed output.
## Team AI Coding Monthly Report
(Filled-in template example: the following numbers are illustrative placeholders.)

## This Month at a Glance
- Features completed: 12
- Completed with AI assistance: 10 (83%)
- Average delivery cycle: 2.5 days (3.2 days last month)
- Defect density: 6 per thousand lines (8 last month)

## Quality Data
- Acceptance pass rate: 85% (first attempt)
- Architectural drift rate: 8%
- Test coverage: 65%

## Key Projects
| Project | Features | Delivery cycle | Quality status |
|:----|:-----:|:------:|:------:|
| Project A | 5 | 2 days | ✅ Healthy |
| Project B | 3 | 3 days | ⚠ Needs attention |

## Recommendations for Improvement
1. The 85% acceptance pass rate is low; strengthen training in clear instructions.
2. The 8% architectural drift rate is manageable; maintain it.
3. Test coverage of 65% still falls short of the 80% target.
Part Eight complete. You have now mastered the complete methodology for building permanent automated defense lines: three quality defense lines (prevention/inspection/audit) and four quality gates, a gray-release anomaly handling SOP with data inspection, a fail-early culture, the test power grid (test before refactoring, hard coverage standards, the critical “execute and fix all failing tests” instruction), anti-degradation contracts (commit hash baselines, prompt anti-degradation clauses), and risk control and efficiency metrics (seven risk categories, a five-step risk management process, four-dimension efficiency/quality/team/customer-side metrics, and four measurement traps).
Now, let us enter Part Nine: Customer Delivery — From Session Pipeline to Customer Field. There, the methodology enters the three customer-project phases of scoping, validation, and delivery.
Independent exercise
Use fictional or authorized deidentified material. Answer independently before revealing the reference. Save chapter-26.md with versions, decisions, evidence and gaps.
Make a four-row risk register with likelihood, impact, trigger, owner and response. Define two efficiency metrics with denominators, windows and rework.
Required chapter artifact: risk-and-efficiency metric tree
The submission for this independent exercise must contain the evidence below. The existing prompts supply content but do not replace these acceptance items.
- O1: The risk-and-efficiency metric tree branches from quality metric to delivery cost and adoption evidence with the hierarchy labeled
- O2: Every leaf in the risk-and-efficiency metric tree records a baseline, current value, trend and data source
- O3: The artifact records a baseline, trend, source and trade-off for quality, cost and adoption metrics
Reveal reference feedback (answer first)
Reference feedback
Measure total time per accepted task and rework while tracking defects and adoption. Lines of code and online time do not establish value. Include model, review and repair costs. Leave unmeasured gains blank rather than inventing ROI.
Self-review and next steps
Check whether your decision is explicit, evidence reproducible and unknowns honestly recorded. The reference illustrates one defensible approach, not a unique answer. Seek peer review for alternatives with equivalent evidence. Mark unsupported parts unfinished and revisit the corresponding step.
Sources and boundaries
Registered sources support only the external claims used here. The risk-and-efficiency metric tree, example numbers and exercise scenario are internal instructional design and require project-specific validation.
- Google SRE: Monitoring Distributed Systems
Google · 2026-09-17 · Monitoring should focus on actionable signals and distinguish symptoms, causes, white-box and black-box information.
- NIST AI Risk Management Framework
National Institute of Standards and Technology · 2026-09-17 · AI risk governance requires ongoing identification, measurement, management and documentation across design, development, deployment and use.
Record lesson practice
Only a browser self-check is saved. No work is uploaded, reviewed or certified. Keep evidence and gaps in your own chapter file.